2024 Creek Watcher Report Card Blog
In August of 2024, Tropical Storm Debby lingered over the lowcountry for days – saturating Charleston with record amounts of rainfall and widespread flooding. Charleston’s streets were inundated with water as drainage infrastructure struggled to keep up. Floodwater permeated our rivers and creeks with frequent reports by community members documenting abnormally brown, tannic water in our waterways for weeks. Pollutants like fertilizer, fecal matter, tirewear microplastic particles, and chemicals that accumulate in floodwater as it flows across roads, lawns, and through sewage overflows would ultimately end up in the waterways where we fish and swim.
Events like these put not only the quality of Charleston’s waterways at stake, but also of the organisms and communities that depend on them. Events like these are also occurring more frequently and with greater intensity due to warmer temperatures and rising sea levels.
Events like these are why we need our Creek Watchers.
Who are Creek Watchers?

Creek Watchers are local volunteers trained under the Adopt-A-Stream Tidal Saltwater Monitoring model as community scientists to conduct independent monthly water quality tests throughout your waterways. Creek Watchers serve as Charleston Waterkeeper’s eyes and ears on the water, helping to expand our water quality sample collection range while building a community of engaged volunteer monitors. Their efforts help keep us informed of water quality issues and serve as the foundation of our work to drive policy change for our waterways.
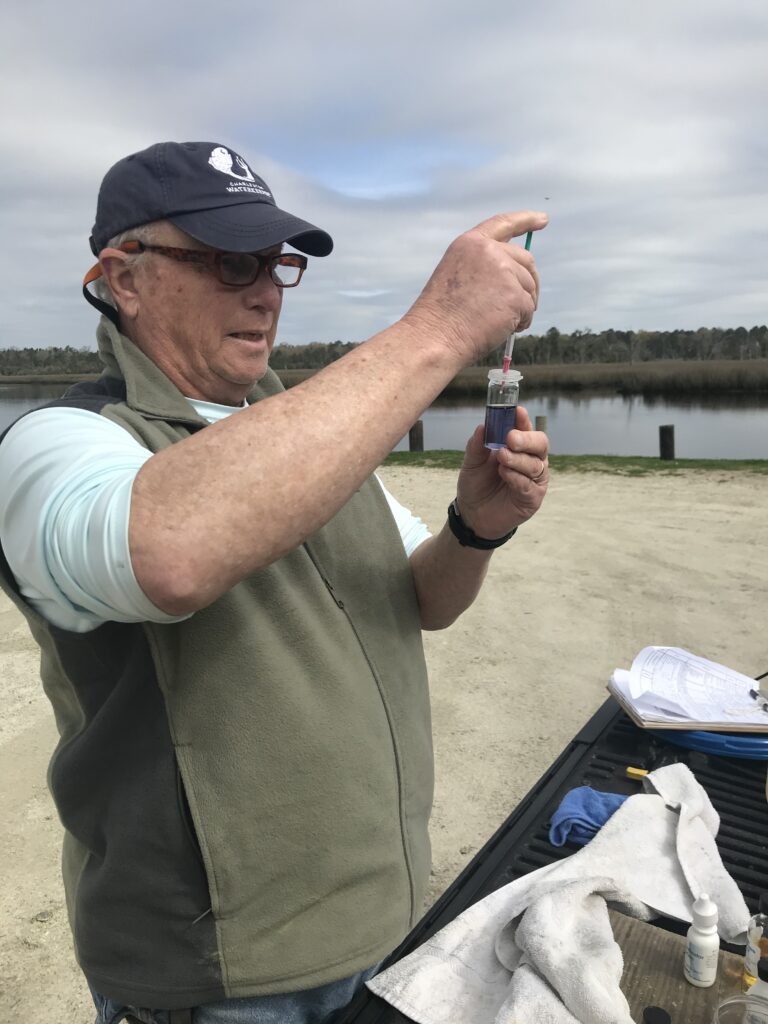
We’re taking the vital signs of the Ashley River to gauge its health. [Good water quality] is important for recreation, but it’s also important for health. To get slightly philosophical, water is life.
— Mike Marcell, Creek Watcher, speaking to Live5 News as he and his wife JoAnne conducted their first monthly water quality test post-Tropical Storm Debby (Live5 News)
Just like having your heart rate and blood pressure taken by the doctor during a checkup, the vital signs of our waterways monitored by Creek Watchers include air temperature, water temperature, pH, dissolved oxygen, salinity, and water clarity. Each of these are measured and recorded during monthly sampling events at sites they have “adopted.” This data establishes a baseline for what our waterways look like month to month, making it possible for us to identify and act when levels are abnormal.
In 2024, a total of 52 Creek Watchers volunteered 649 times at 50 sites, donating 756 volunteer hours – a contribution valued at over $25,000!
What are Creek Watcher Report Cards?
Each year, Charleston Waterkeeper creates a report card that compares a site’s data to South Carolina’s water quality standards. The report cards are a good gauge of a site’s habitat health and water quality.
👉 Explore the 2024 Site Map below!
Note: Click on any placemark to view that site’s 2024 report card. This map includes only those sites with enough data to generate a full annual report card. Breaks in graphs indicate missing data.
How are Grades Assigned?
Each water quality parameter (or vital sign) is graded based on how often it meets its state quality standard over the year (see detailed standards and grading rubric below). For example, if the water temperature of a site met the state standard of less than 32.2ºC for 85% of sampling events, the site received a B for that parameter. There’s no numerical standard for debris, but the narrative standard calls for none. Debris grades are based on how often Creek Watchers reported “no debris” during monitoring events.

How’d the Water Look in 2024?
Overall, the 2024 data highlighted ongoing concerns about debris and dissolved oxygen (DO), especially during hot summer months and after extreme weather events like Tropical Storm Debby. However, positive trends in water clarity and pH stability were also observed, and biological diversity (especially among birds!) remained strong.
Here’s the Breakdown by Parameter:
Water Temperature (standard: <32.2°C): All sites earned an A for water temperature in 2024, making it our best-performing parameter. While Tropical Storm Debby caused short-term fluctuations at a few sites, temperatures remained within normal ranges. Since warmer water holds less oxygen, maintaining stable temperatures remains vital for protecting aquatic life.
pH (standard: 6.5-8.5): pH, the measure of how acidic or basic the water is, continued to perform well in 2024 with most sites reporting stable pH values throughout the year. Notably, Remley’s Point held a steady pH of 8 all year. Steady pH values are key to protecting aquatic organisms, especially those sensitive to changes like shellfish and fish in early life stages.
Dissolved Oxygen (DO; standard: >4.0 ppm): DO remained one of the most variable parameters again in 2024. Post-Debby measurements at several sites dipped as low as 1–2 parts per million (ppm) – well below the state standard necessary to support healthy aquatic life. Seasonal fluctuation is expected given warmer water naturally holds less oxygen, and our DO levels followed this trend with lower levels reported in the summer months. However, prolonged low DO levels can lead to ecosystem stress and even fish kills. Warmer waters and more frequent storm activity continue to be major contributing factors and cause for concern.
Water Clarity (standard equivalent: >30 cm): Measured by the depth of light penetration through the water column, water clarity followed a seasonal pattern similar to DO. Water clarity can be impacted by floodwaters entering our waterways which stir up sediment and increase turbidity. Clear water allows aquatic plants and organisms to thrive, and most sites showed typical variation with no major red flags.
Debris: Debris remained a mixed bag in 2024. Sites like Filbin Creek and Northbridge Park reported persistent trash despite cleanup efforts. Others, like Pitt Street Bridge, Church Creek, and Shem Creek Park, showed marked improvement from previous years. Monthly observations from Creek Watchers directly inform local cleanup efforts and help track progress regarding litter presence. Continued vigilance and community involvement are key to keeping our waterways clean and safe!
Change Over Time (2018-2024):
Charleston Waterkeeper launched the Creek Watcher project in 2017 to connect locals to their waterways and keep tabs on the overall health of our estuary (read more on the project’s history here). The first volunteers were trained and certified in June of 2018 and monitoring officially kicked off in July. The program has grown substantially since its origin, but we’ve noticed some trends emerge when looking back at the data from our longest-monitored sites:
- Water temperatures are rising,
- Salinity levels are increasing, and;
- pH values are decreasing (becoming more acidic).
👉Check out the 2018-2024 data trend charts here.
Though water temperatures still fell below the state standard of less than 32.2ºC for all sampling events in 2024, average temperatures have risen since 2018. Warmer waters and lower pH levels are facilitated by ocean acidification and higher global air temperatures – both of which stem from increased atmospheric CO₂ and its diffusion into the ocean (Doney et al., 2009). Meanwhile, rising sea levels push saltwater further inland, raising salinity levels in estuarine environments like our watershed.
Interestingly, pH and salinity are usually positively correlated: saltwater generally has a higher pH than freshwater. So, as salinity increases, we’d typically expect pH to rise as well. However, our data shows the opposite: salinity is rising while pH is declining. This unusual pattern suggests that other factors – like ocean acidification driven by increased levels of atmospheric CO₂ – may be overpowering the natural relationship between salinity and pH. This deviation from the expected salinity–pH trend is ecologically important, as reduced pH can impair shell formation, metabolic function, and reproductive success in sensitive estuarine and marine organisms (Kroeker et al., 2013).
Detecting shifts like these underscores the value of long-term water quality monitoring and the importance of proactive management in the face of changing environmental and chemical conditions. These findings support the need for action at local and state levels and enable us to inform decision makers on what policies will work best to protect and defend your right to clean water. Our Creek Watchers continue to be the eyes and ears (and hands!) of our waterways, helping to ensure these habitats are healthy and resilient for future generations. Thanks to our Creek Watchers, we can act on what we see, advocate for stronger protections, and work toward cleaner, healthier waterways for all.
Interested in becoming a Creek Watcher?
Email britney@charlestonwaterkeeper.org to learn how you can get involved!
References
Doney, S. C., Fabry, V. J., Feely, R. A., & Kleypas, J. A. (2009). Ocean acidification: The other CO₂ problem. Annual Review of Marine Science, 1, 169–192. https://doi.org/10.1146/annurev.marine.010908.163834
Kamin, Katie. “Water quality tests in Debby’s aftermath raise post-storm safety worries.” Live 5 News, 2 Sept. 2024. https://www.live5news.com/2024/09/02/water-quality-tests-debbys-aftermath-raise-post-storm-safety-worries/
Kroeker, K. J., Kordas, R. L., Crim, R. N., & Singh, G. G. (2013). Meta‐analysis reveals negative yet variable effects of ocean acidification on marine organisms. Ecology Letters, 13(11), 1419–1434. https://doi.org/10.1111/j.1461-0248.2012.01856.x