Swim Alert: See Your 2026 Season in Review
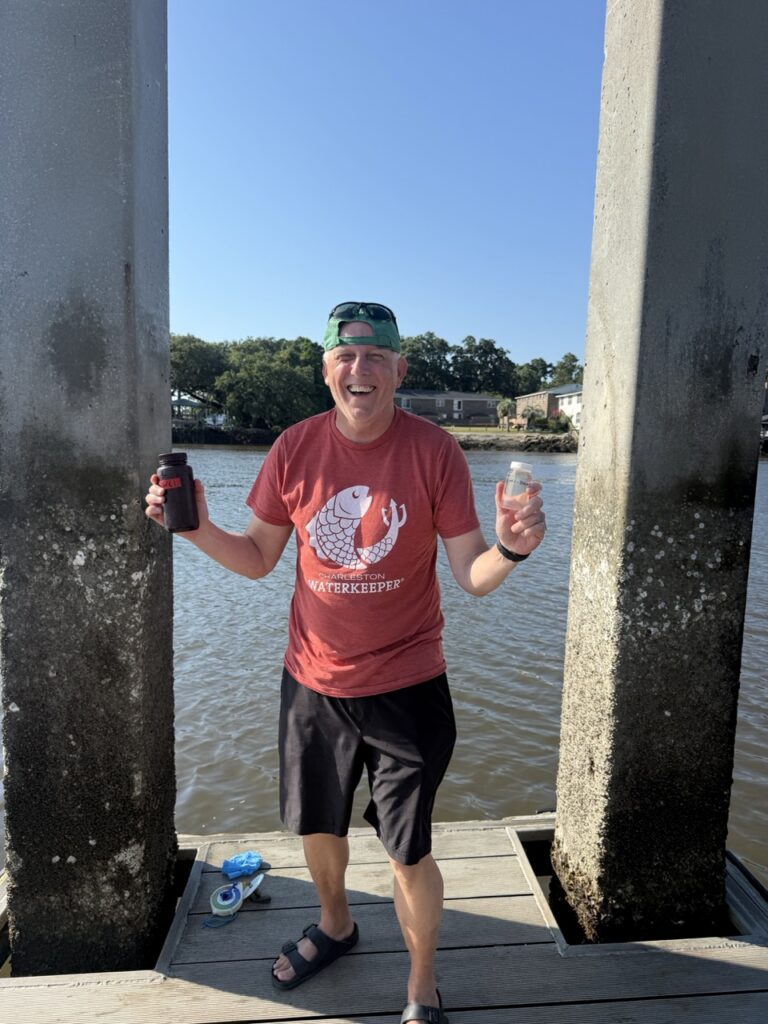
We just wrapped up the 14th season of our Swim Alert monitoring program at the end of October! We sampled weekly on Wednesdays since May to test levels of fecal indicator bacteria and report back to you, the community. Now that the season is over, we thought it would be fun to look at the year by the numbers.
How does 2026 compare to past seasons? In 2026, we collected a total of 499 water samples. 114 of these, or 23% of all samples, exceeded the limit for safe swimming (104 MPN/100 mL). This is an improvement from last year, down from 29% in 2025! What’s different? The drought. If you’ve followed our reports over the years, you’ve seen us talk about stormwater and how dirty it is. Well, we didn’t get much rain this year, so we didn’t see as much influence from polluted stormwater runoff. A little bit of silver lining in the drought.
What was the highest result this season?
The highest result this year was 8,297 MPN/100 mL, or about 80x the limit for safe swimming. This result was observed in the Ashley River at Brittlebank Park on August 19. This number is down from 24,196 MPN/100 mL in 2025. So not only did we not see as many high results in 2026; the highs were overall lower than previous years. Again, we have the drought to thank.

What patterns do we see?
Site by site, week by week, we see a variety of conditions throughout the season. But some things are consistent, like elevated levels of enterococci in Filbin Creek at Hendricks Park, with the average level being over 1,000 MPN/100 mL. In fact, we have been observing this trend since 2021. On the other hand, we see low levels of enterococci in the Wando River at the Daniel Island Waterfront every week. The average level for 2026 was just 14 MPN/100 mL.
Which results are less predictable?
And some things aren’t so consistent. James Island Creek seemed to be doing better this year. When we ran the numbers, we noticed that the exceedance rate dropped from 81% in 2025 to 56% in 2026! Furthermore, the highest result seen this year dropped to 683 MPN/100 mL from 1904 MPN/100 mL in 2025! Was it the drought? Was it improvements to sewage infrastructure? Was it better septic maintenance? Does everyone on James Island now pick up their pet waste? Truth is, it could be all of those things! But we like this downward trend!
Where does our data get put to use?
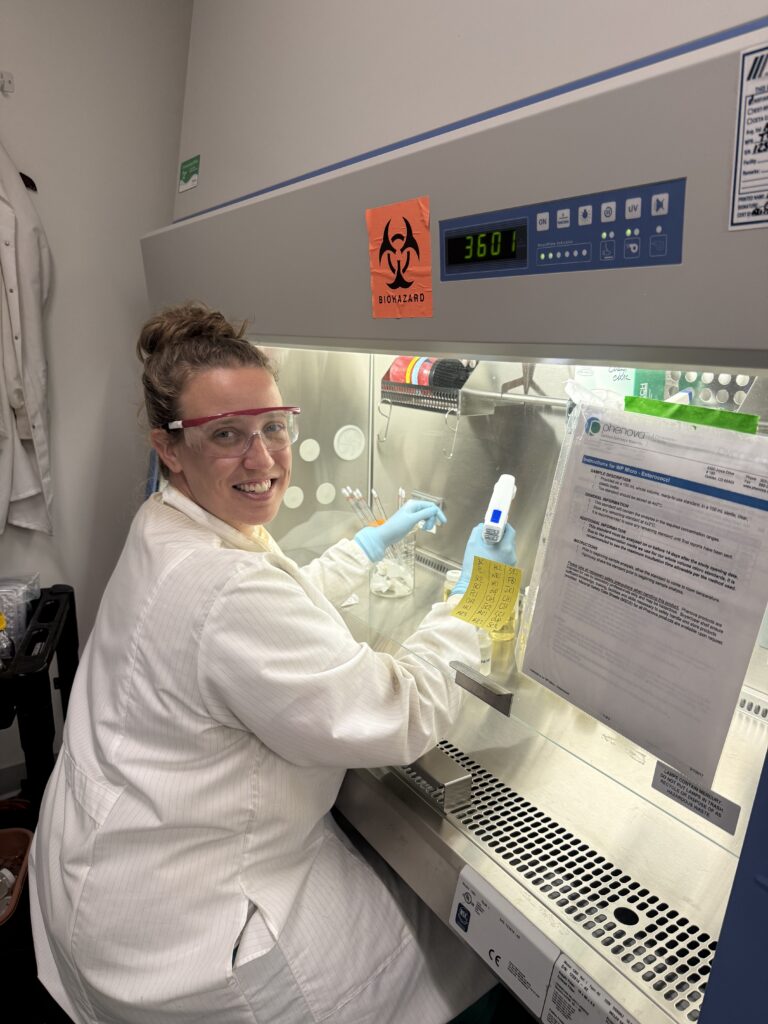
The great thing about our Swim Alert program is that now all of this data goes to our state’s Department of Environmental Services. We operate our program under a DES-approved Quality Assurance Project Plan and analyze all of our samples in a certified laboratory. It takes a little bit more time and effort, but the quality of the results is worth it. When DES compiles data for the 303(d) List of Impaired Waters, our data is included. The draft 2026 303(d) list includes 11 Swim Alert sites. That means the data doesn’t stop with weekly reports in your inbox and on social media, our data is driving change for our communities and our waterways!
Thanks for sticking around this season, and we’ll see you back in May!